
Analysis of the model for a 6.60 m flood
The reference year is 1999 with a flood height of 662 cm at the Mopti gauge.
The
course
of
the
1999
flood
deviates
quite
significantly
from
the
660
cm
reference
flood.
Indeed,
the
maximum
flood
height
of
617
cm
at
Ké
Macina,
which
determines
the
flooding
of
the
upstream
Delta
and
along
the
Diaka,
stands
39
cm
lower
than
the
reference
situation
which
should
be
close
to
656
cm.
This
deficit
is
compensated
in
Mopti
by
the
stronger
flood
of
the
Bani
River
in
Sofara
(+
35
cm
compared
to
the
reference
situation).
However,
the
large
time
lag
between
the
date
of
the
maximum
height
in
Sofara
and
that
in
Mopti
(32
days
against
8
days
on
average),
as
well
as
the
difference
in
volume
contributions
between
Niger
and
Bani, result in a lower flood than expected in Akka, at the exit of the Debo lake.
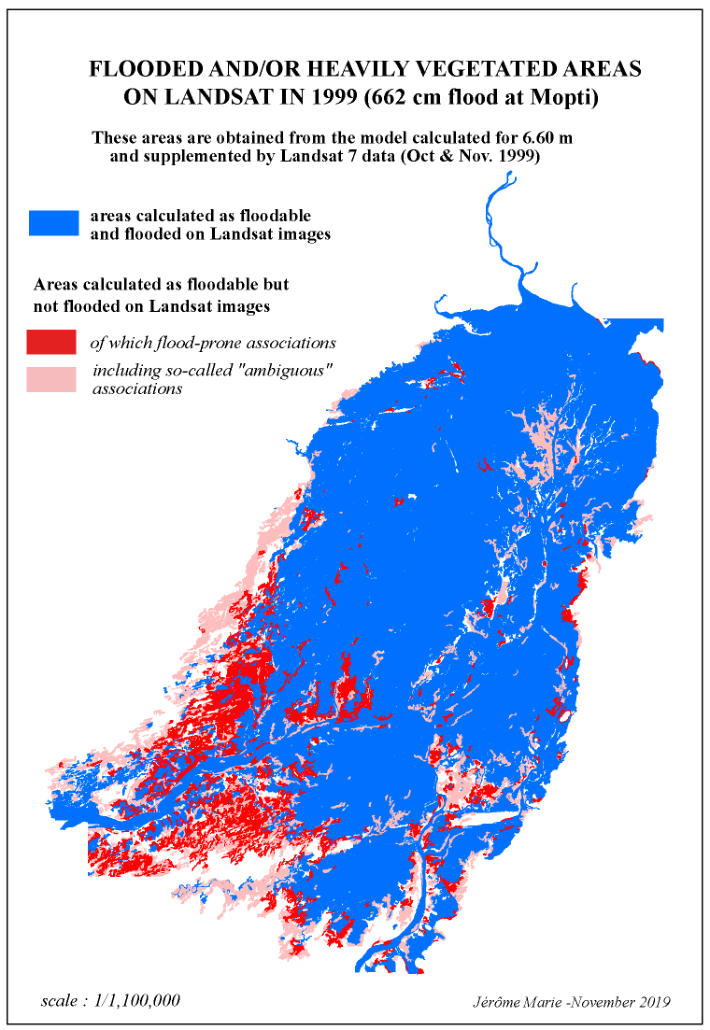
Landsat images are available for October 18 (198_050), October 27 (197_050 and 051) and November 28: (197_049, 050, 051).
The shape file (Synthèse_660_1999) regroups these different situations :
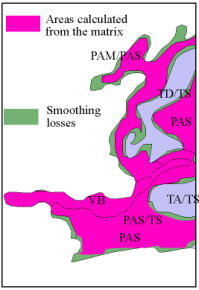
•
The areas in blue on the map are the flooded areas common to the model and the Landsat images.
•
The pink and red areas (Inon_ less) are two different cases of mismatch:
1-
In
pink
:
(value
3
of
the
item
carto)
areas
are
shown
vegetation
mosaics
associating
"non
floodable"
vegetation
(
Togge
)
or
vegetation
potentially
flooded
by
run-off
first,
with
floodable
vegetation
that
were
poorly
flooded
in
1999.
The
former
case
includes
the
following
vegetation
mosaics:
AG
/
TA,
AG
/
TS,
ZB
/
TA,
ZB
/
TS,
P
/
TA,
P
/
TS,
VH
/
TA,
VH
/
TC,
VH
/
TS,
ESP
/
TA,
VSP
/
TA,
PAM
/
TA,
PAM
/
TD,
PAM
/
TS),
while
the
latter
case
includes
the
vegetation
mosaics
PAM,
PAN,
PAS,
PAM
/
PAN,
PAM
/
PAS,
ZB
/
PAN,
ZB
/
PAS,
PAM
/
P,
PAM
/
VH,
PAM
/
VOR,
P
/
PAN,
P
/
PAS.
Together,
these
mosaics,
whose
flood
status
is
regarded
as
"ambiguous",
extend
over
194,160
ha,
of
which
154,331
ha
were
not
flooded
in
1999,
while
only 39,829 ha were flooded.
2-
In
red
:
(value
2
of
the
carto
item)
are
shown
floodable
vegetation
formations
or
mosaics
that
are
flooded
according
to
the
model
but
not
on
Landsat,
amounting
to
143,614
ha.These
non
flooded
areas
distributed
by
flood
depth
level
as
indicated
in
the following table:
The
majority
of
these
non-flooded
areas
on
the
1999
Landsat
images
are
concentrated
around
Diafarabé,
in
the
Moura
plains,
in
the
southern
Pondori
basin
and
in
the
high
plains
of
Sébéra.
They
result,
for
the
first
two
cases,
from
the
water
height
deficit
(-39
cm)
noted
at
Ke
Macina
and,
for
the
other
two
cases,
possibly
from
a
poor
flood
provision
by
the
Bani
despite
the
higher
than
expected
flood
height
recorded
in
Sofara.
However,
the
last
statement
should
be
carefully
considered:
the
Pondori
basin
can
be
flooded
very
early
(in
August)
and
have
only
reduced
flooded
areas
in
the
extreme
south by November. In the absence of available images in August, it is difficult to decide.
660_1999.gdb.rar contains :
NIV_660
Synthese_660_1999 :
Item inon_543: Value 1: flooded area common to Veg7_21 and Landsat
Value 2: area flooded by the model but not flooded on Landsat
Item carto: Value 1: flooded area common to Veg7_21 and Landsat
Value 2: area flooded by the model, not flooded on Landsat and
composed of floodable vegetation by the river flood.
Value 3: not flooded on Landsat and composed of vegetation
whose flood status is ambiguous (list above)


![[-0.10 à -0.30] 82 090](index_htm_files/16148.png)
![]-0.30 à -0.60] 47 258](index_htm_files/16149.png)
![]-0.60 à -1.50] 13 625](index_htm_files/16150.png)
![]-1.50 à -2.80] 721](index_htm_files/16151.png)
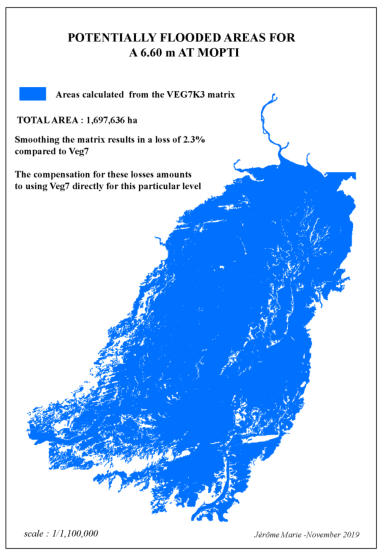
On
the
raw
matrix
model
(NIV_660),
the
flooded
areas
extend
over
1,697,636
ha
.
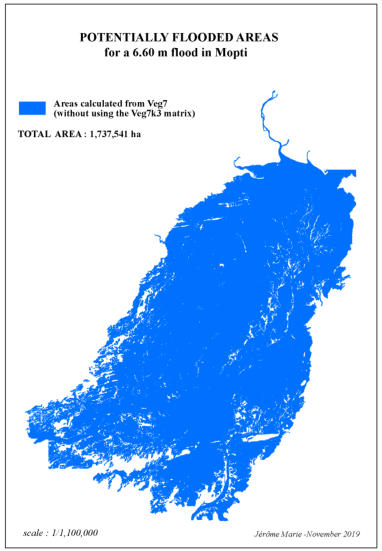
The
area
of
floodable
vegetation
units
on
VEG7
(without
Farimaké)
measures
1,737,541
ha,
with
the
smoothing
done
with
the
500x500
filter
causing
an
area
loss
of
2.3%.
The
reintroduction
of
these
“lost”
flooded
areas
does
not
pose
any
difficulties:
it
comes
down
to
using
VEG7
directly
by
removing
level
11 (non flooded) (shape VEG7_21).
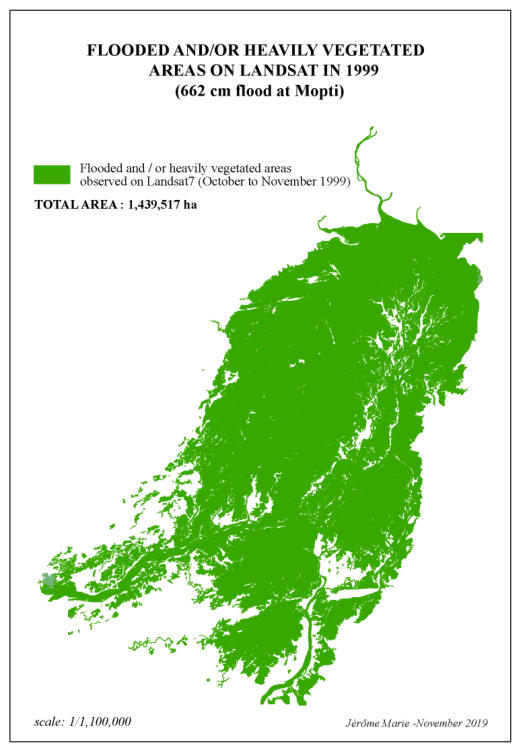
Overlaying
Landsat
images
in
VEG7_1999
(shape
file
VEG7_
1999)
gives
a
fairly
different
representation
of
the
flood,
with
a
total
flooded
and/or
heavily
vegetated
area
*
of
1,439,517
ha.
*
excluding
areas
heavily
vegetated
by
woody
plants
such
as
the
Togge
in the south of the Delta, for example.
The
entire
flooded
/
vegetated
surface
of
VEG7_1999
(Landsat)
is
within
the
limits
of
VEG7_21
so
that
the
area
common
to
Landsat
and
VEG7_21
extends
over
1,439,
517
ha
.
However,
such
a
method
is
only
applicable
in
this
particular
case.
For
the
other
flood
levels
analyzed,
the
flood
heights
do
not
correspond
to
an
application
limit
of
the
model,
and
we
will
see
that
the
flooded
(and
/
or
heavily
vegetated)
surfaces
on
Landsat
never
completely
fall
within
the
limits
calculated
by
the
model
for
the
maximum
flood
height
at
Mopti.
In
the
model,
there
are
areas
flooded
in
addition,
while
some
flooded
areas
are
missed
by
the
model.
We
used
the
spatial
operator
“intersect”
between
the
area
calculated
by
the
model
and
the
"flooded"
surface
recorded
on
Landsat and corrected the errors due to the matrix smoothing.
The
area
flooded
on
Landsat
in
1999
was
within
the
area
flooded
calculated
with
the
model.
The
ratio
between
the
area
flooded
on
Landsat
VEG7_1999
and
on
VEG7_21,
equals
82.8%,
a
relatively
poor
score
explained
in
part
by
the
extent
of
vegetation
associations
with
"ambiguous"
flood
status,
and
in
part
by
the
characteristics
of
the
1999
flood,
i.e.
the
strong
imbalance between the Niger and the Bani floods.
The
difference
between
the
model
run
for
a
660
cm
height
(VEG7_21)
and
the
year
1999
(VEG7_SF_1999)
as
assessed
by
the
spatial
operator
is
recorded
in
the
shape
file
(Inon_
less_660_1999)
and
extends
over
298,024
ha
,
calculated
as
flooded by the model and not flooded on Landsat images.
660_1999.gdb.rar
+
Download