
Analysis of the model for a 6.21 m flood
The NIV_621 model is compared with the 2001 flood, the characteristics of which are as follows:
*
The
model
by
Jean
Pierre
Lamagat,
a
Hydrologist
at
IRD,
dates
from
1983.
It
established
correspondences
between
the
heights
of
the
floods
between the main gauges along the Niger River. It was used in particular for the development of the Mathematical Model of the Niger River
.
Once
again
the
2001
flood
is
quite
particular:
the
flood
level
at
Ké
Macina
matches
a
6.60
m
flood
at
Mopti
and
not
a
6.21
m
flood.
The
Bani
flood
at
Sofara
is
slightly
lower
than
expected,
given
the
flood
height
in
Mopti
(about
-
6
cm).
The
flood
height
is
a
little
lower
than
expected
in
Akka
at
the
exit
of
the
Débo
lake.
Moreover,
the
observed
duration
of
the
flood
propagation
strongly
differs from the model predictions for the Sofara to Mopti and Mopti to Akka stretches.
These
peculiarities
partly
explain
the
differences
between
the
analysis
of
model
outputs
and
Landsat
images
for:
October
7,
198_050 (west of the Delta), October 16, 197_051 (south of the Delta) and November 17 for 197_051, 050 and 049 (entire Delta).
Flood
NIV_621
takes
the
form
of
a
massive
block
in
the
center
and
north
of
the
Delta,
with
only
a
notch
by
Peru
Dialloubé.
The
flood
extent
is
more
complex
in
the
south
with
large
flooded
basins
(south
of
Mopti,
Yongari,
Mangari,
Pondori)
soon
tapering
between Diafarabé and Ké Macina, upstream of the Delta. The total flooded area calculated by the model is 1,417,331 ha.
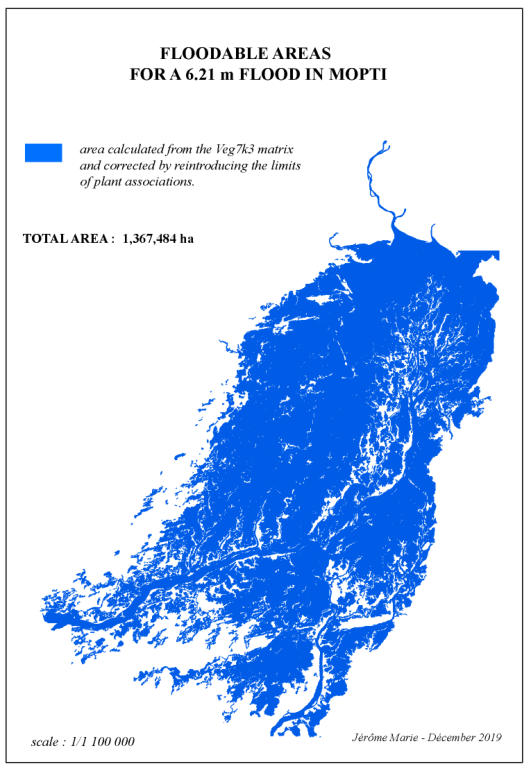
After
correcting
the
errors
related
to
the
smoothing
of
the
matrix
(both
in
terms
of
additions
and
substractions),
the
potentially
flooded
area
of
NIV_621_Veg7
is
1,367,484
ha.
The
relatively
large
gap
due
to
correction
is
explained
by
the
deletion
of
vegetation
unit
fragments
whose
depth
range
is
between
-0.05
cm
and
-0.35
cm.
The
flood
depths
between
-0.35
m
and
-0.45
m
are
dubious
for
a
6.21m
flood
at
the
Mopti
gauge
(-0.39
m
below
the
reference
height),
as
they
are
intergraded
mosaics
between
levels
-0.10
and
-
0.60
(-0.35
m)
and
between
-0.30
and
-0.60
(-0.45
m).
Parts
of
these
mosaics
were
therefore
likely
to
be
flooded.
The
floodable
area
of
1,367,484
ha
should
therefore
be
taken
as
minimum
area,
the
areas
at
level
-0.35
in
the
niv_621
model
extending
over
1672
ha
while the areas at -0.45 m were kept within flooded areas.
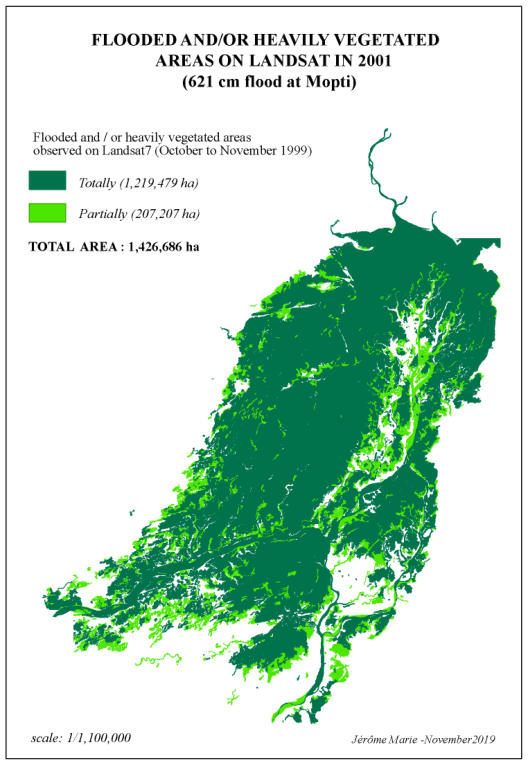
The
total
flooded
area
on
Landsat
(shape
VEG7_2001)
reaches
1,426,684
ha,
a
greater
value
than
the
flooded
area
calculated
by
the
model
(NIV_621_Veg7)
with,
in
particular,
flooded
areas
in
the
southwest
of
the
Delta
(Diafarabé
region)
sharply
marked
by
flood
on
images
of
October
7
and
16
,
which
no
longer
appear
flooded
on
the
image
of
November
17.
The
fully
flooded
or
vegetated
areas
cover
1,219,477
ha,
to
which
207,207
partially
flooded
ha
must
be
added.
Out
of
this
total,
11,611
ha
(4,597ha
totally
flooded
and
7,014
ha
partially
flooded)
were
flooded
on
October
16
but
did
not
bear
a
marked
green
vegetation
cover
in
November
17.
These
formations, all located in the Diafarabé region, have a flood depth equal to, or lower than -0.30 m.
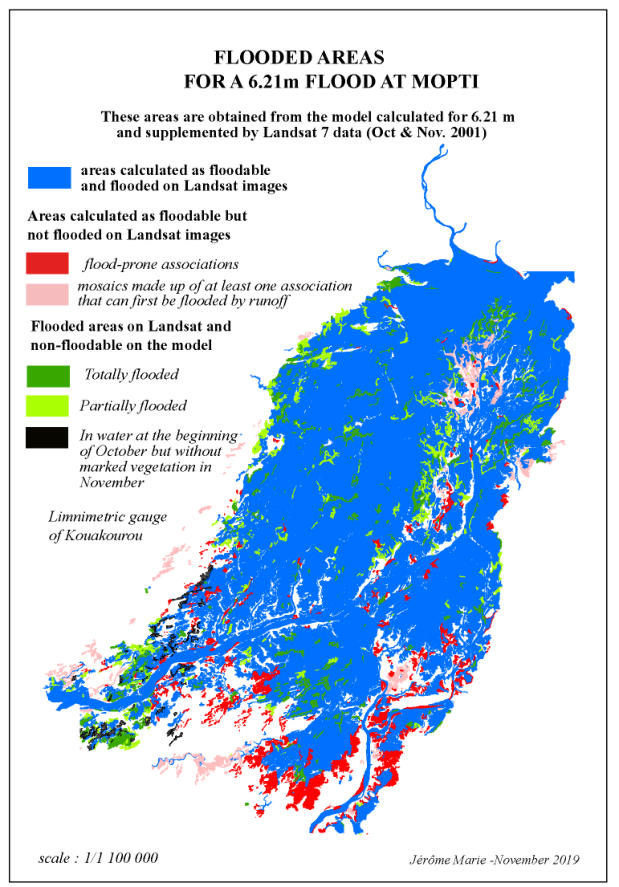
This
complex
reality
is
reflected
in
the
flooded
area
common
to
the
model
shape
(NIV_621_Veg7)
and
to
Landsat
2001
images
-shape
(VEG7_2001)-.
The
shape
file
(Commun_621_2001)
resulting
from
their
overlay
shows
a
flooded
area
of
1,276,476
ha
,
of
which
1,154,624 ha
are totally flooded / or vegetated; and
121,852 ha
are partially flooded.
1
–
If
partially
flooded
areas
are
included,
the
confidence
ratio
of
the
model
–
the
ratio
between
the
total
surface
of
(Com_621_2001)
and
that
of
(Niv_621_Veg7)
–
reaches
93.3%
.
If
only
the
totally
flooded/vegetated
areas
are
taken
into
account,
the ratio is
84.4%
. The actual value must be between these two rates.
2
-
The
comparison
between
(Niv_621_Veg7)
and
(VEG7_2001)
shows
flooded
areas
on
Landsat
which
are
not
flooded
in
the
model
shape
(Inon_plus_2001);
and
conversely,
areas
calculated
as
flooded
by
the
model
which
are
not
so
on
Landsat
shape
(Inon_
moins_2001)
The shape (synthèse_621_2001) includes (Commun_621_2001, Inon_plus_2001, Inon_ moins_2001)
On
the
combined
map,
the
areas
flooded
on
Landsat
and
which
are
not
flooded
by
the
model
all
have
depths
between
-0.05m
and
-0.35
m
and
the
majority
are
only
partially
flooded.
They
are
mainly
distributed
in
the
Diafarabé
region,
at
the
edges
of
Yongari-
Mangari,
at
the
edges
of
the
main
flooded
area
which
extends
from
the
west
of
the
Delta
to
the
Peru
Dialloubé.
They
clearly
mark
the
influence
of
the
strong
flood
observed
at
Ké
Macina
(+63
cm),
compared
to
the
model
prediction.
This
strong
flood
affects
the
Diaka
and
the
Niger
up
to
the
defluent
feeding
the
Yongari,
at
Kouakourou.
Beyond
Kouakourou,
this
influence
is
offset
by
the
deficit contributions from the Bani River and becomes negligible.
A
significant
part
of
these
areas
(shown
in
black
on
the
map),
all
located
in
the
Diafarabé
region,
were
flooded
on
October
16,
but
do
not
bear
a
marked
green
vegetation
cover
marked
on
November
17.
All
these
vegetation
units
have
a
maximum
water
depth
of
-0.30
m.
The
cause
is
probably
linked
to
a
flood
peak
(between
6
m
and
6.62
m)
which
lasts
only
25
days,
too
short
to
sustainably
affect vegetation growth.
The
non-flooded
areas
illustrate
two
concomitant
phenomena:
the
poor
water
supply
of
the
Pondori
basin
where
flood
is
very
early
and
is
reinforced,
in
2001,
by
the
Bani
flood,
which
is
slightly
in
deficit
and
late.
The
areas
flooded
on
Landsat
images
and
which
are
outside
the
areas
calculated
by
the
model
illustrate
the
role
played
by
an
imbalance
in
the
inflows
between Niger and Bani. In the case of the 6.60 m flood, the deficit from the Niger at Ké Macina resulted in smaller
flooded
areas
in
the
Diafarabé
region
and
the
Moura
plain.
In
the
case
of
2001,
the
higher
flood
in
Ké
Macina
resulted
in
a
larger
flooding
in
the
same
region,
although
transient
in
part.
This
imbalance
of
contributions
partly
affects
the
logic
by
depth levels developed in Delmasig.

The
areas
calculated
as
flooded
by
the
model
which
are
not
flooded
on
Landsat
represent
89,930
ha
(inon_
moins_2001)
of
which
31,766
ha
extend
over
vegetation
mosaics
which
include
vegetation
associations
that
are
first
flooded
by
run-
off,
and
58,164
ha
extend
on
vegetation
which
is
normally
floodable.The
distribution
by
flood
depth
level is given in the following table:
Floodable
vegetation
not
flooded
on
Landsat
2001
images (on 58,164 ha)
Among
the
areas
not
flooded,
those
first
flooded
by
run-off
are
mainly
distributed
on
the
periphery
of
the
Delta,
in
Dialloubé
Peru
and
on
the
Chibon,
at
the
far
east
of
the
Pondori
basin.
The
flood-prone
formations
(in
purple)
are
found
mainly
in
the
south
of
Pondori,
and
along
the
right
bank
of
the
Bani,
south
of
the
erg
of
Femaye,
and
in
the
high
plains
of
the
Sébéra,
whose
flood
is
provided
by
the
Bani,
as
well
as
in
Peru
Dialloubé
where
flood
is
provided
by
the
Niger,
downstream
from
the
confluence
with
the
Bani.
However,
the
Landsat
images
also
reveal
flooded
and/or
vegetated
areas
which
are
not
included
in
the
flooded
areas
calculated
by
the
model
for
a
total
of
136,841
ha
(Inon_plus_2001),
which
are
distributed
according
to
the
level
of
flooding:
![Flood depth levels Non - flooded areas (ha) - 0.45 m 19 184 - 0.60 m 13 929 ] - 0.6 m à - 1.50 m] 18 881 ] - 1.50 m à - 4 m] 6 170](index_htm_files/13337.png)


621_2001.rar
Download