Analysis of the model for a 5.97 m flood
The
reference
year
is
2006
with
a
flood
height
of
5.97m
at
the
Mopti
gauge,
which
can
also
be
compared
to
the
year
1996
with 5.95m at the Mopti gauge (but no images available).
In
2006,
the
flood
recorded
at
Ké
Macina
matches
that
of
the
model;
at
Sofara
on
the
Bani
the
flood
is
a
little
higher.
On
the
contrary,
the
resulting
flood
at
Akka
is
lower
than
expected,
with
above
all
a
very
fast
propagation
speed
which
reduces
the
flooding
in Akka.
Unfortunately,
the
repeatability
of
the
Landsat
images
in
2006
is
not
satisfactory
and
the
spatial
coverage
is
incomplete.
The
only
image
198_050
(10/5/2006)
of
the
extreme
southwest
of
the
Delta
is
not
fully
usable
because
it
is
very
noisy;
however,
it
shows
that
the flood is already largely declining in south of the Delta while the north is not yet completely flooded and / or vegetated.
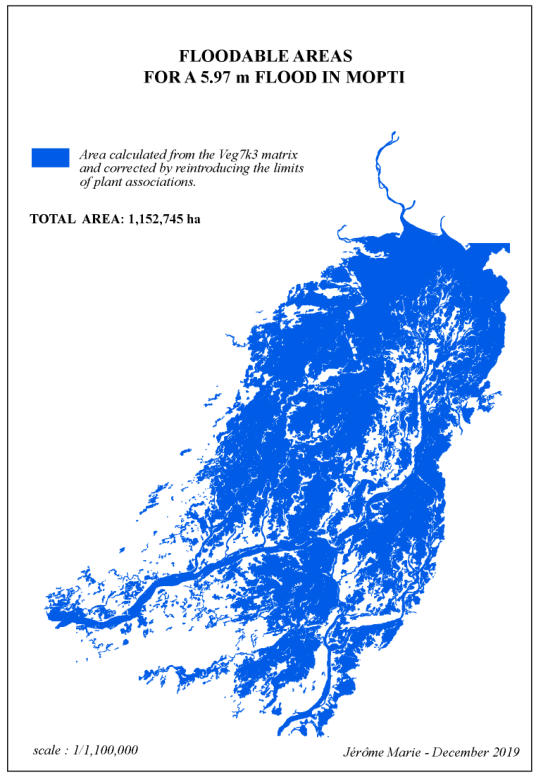
With
a
flood
height
of
5.97m
at
the
Mopti
gauge,
the
area
potentially
flooded
on
NIV_597
totals
1,192,890
ha.
After
integration
within
the
limits
of
Veg7
and
reintegration
of
errors
related
to
the
smoothing
of
the
matrix,
the
flooded
area
calculated
by
the
model
at
5.97m (shape NIV_597_Veg7) is 1,152,745 ha.
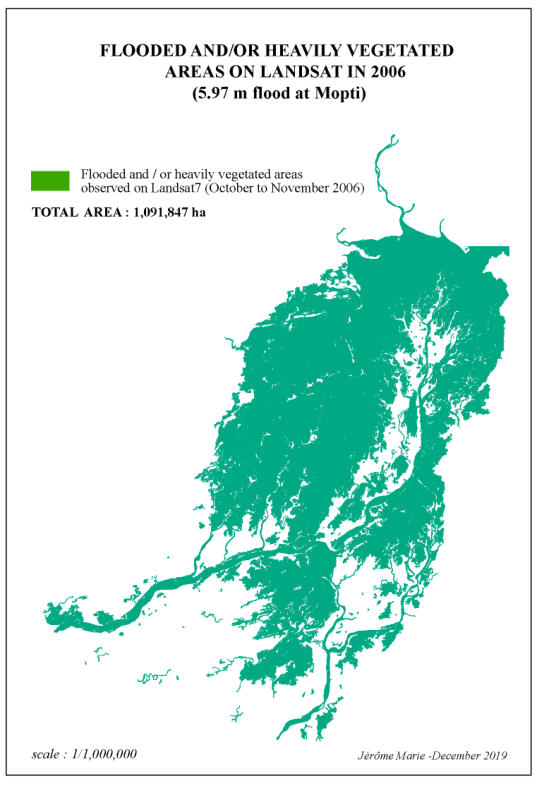
On
the
Landsat
images
of
11/23/2006
(plus
the
image
of
Oct.
30
for
the
south
of
the
Delta)
the
flooded
area
within
the
limits
of
Veg7
reaches
1,091,847
ha.
-
shape
(VEG7_SF_2006)-.
However,
fully
flooded
or
highly
vegetated
areas
extend
over
887,004
ha
while the partially flooded area extend over 204,843 ha.
The
common
area
-
shape
(Commun_597_2006)
-
between
NIV_597_Veg7
and
VEG7_2006
extends
over
987
844
ha.
The
ratio
between this common area and the area calculated by the model thus reaches
85.6%.
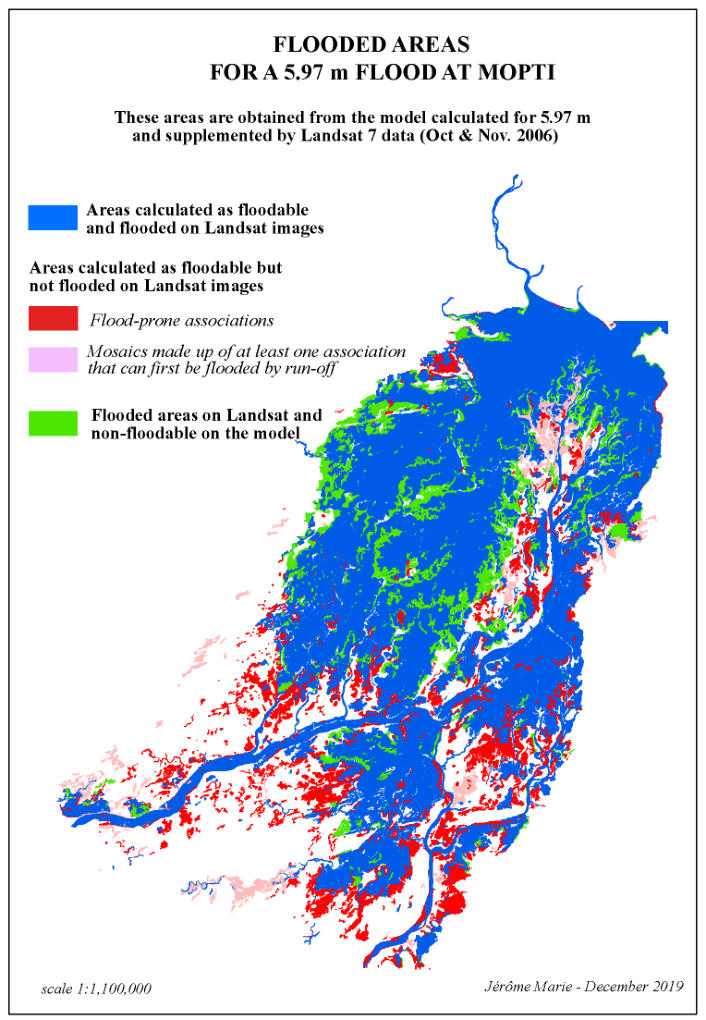
Analysis
of
the
differences
between
the
flooded
area
calculated
by
model
and
observed
on
Landsat
images
(see
the
synthesis map: synthèse_597_2006)
.
Ultimately,
the
synthesis_597-2006
map
shows
the
malfunctions
of
the
model,
with
the
southern
part
of
the
Delta
poorly
supplied
in
flood
(in
red
and
pink
on
the
synthesis
map)
and
the
central
and
north
west
Delta
better
flooded
than
expected
(in
green
on
the
map).
The
flood
extends
around
the
large
basins
of
the
center
and
north
west
of
the
Delta,
Toggere
Koumbe,
Kadial
and
Kakagnan
basins,
as
is
also
highlighted
on
the
map
of
these
large
basins
(Inon_plus_597).
This
“better
than
expected”
flood
might
be
related
to
the
peculiar
longitudinal
profile
of
the
Diaka
(as
explained
for
the
4.40
m
flood
analysis
in
1984).

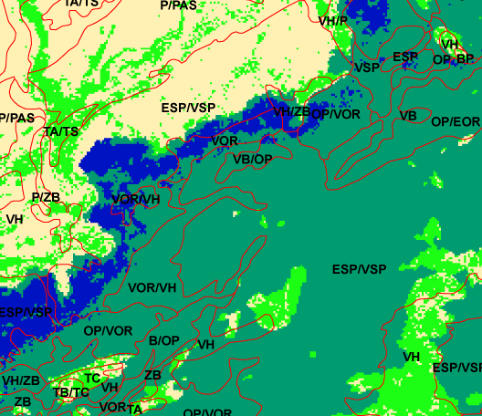
The
classification
of
the
Landsat
image
of
11/23/2006
(tiles
197_050
and
197_049)
with
test
sites
and
maximum
likelihood
criteria
(as
described
on
page
42)
highlights
two
types
of
vegetation
associations
,
strongly
differentiated,
as
figured
on
the
extract located in the northwest of the Delta.
1
–In
dark
green:
a
densely
green
flooded
vegetation,
fringed by open water (in blue)
2
–In
light
green:
a
scanty
green
vegetation
observed
in
some
places
within
the
Delta
and
on
the
Delta
margins.
These
vegetation
units,
which
were
not
flooded
in
November
2006,
still
had
notable
green
vegetation
in
late
October
(South)
and
late
November.
Yet
these
areas
were
not
included
in
the
flooded
areas
observed
on
Landsat
and
compared
with
flooded
areas
calculated by the model.
1
-
the
areas
calculated
as
flooded
by
the
model
but
which
are
not
flooded
on
Landsat
at
the
end
of
November
2006
extend
over
165,492
ha
,
of
which
36,886
ha
are
vegetation
mosaics
of
“ambiguous”
flood
status,
while
128,606
ha
are
vegetation usually flooded by river flood.
The
"ambiguous"
flooded
vegetation
associations
(flooded
by
local
run-off
and
/
or
combining
floodable
with
unflooded
associations)
are
located
in
Peru
Dialoubé,
at
the
edge
of
the
Delta
and
on
the
right
bank
of
the
Bani,
north
of
the
erg
of
Femaye.
They
are
therefore
doubly
marginal,
because
of
their
flooding
status
and
because
of
their
location
at
the
edge
of
the flood plains.
The
flood-prone
vegetation
units
that
were
not
flooded
in
2006
are
located
partly
in
Dialloubé
Peru
but
mainly
extend
in
the
south
of
the
Delta.
The
flood
dysfunctions
in
the
southwest
of
the
Delta
between
Ké
Macina
and
Diafarabé,
and
in
the
south,
between
the
right
bank
of
the
Niger
and
the
Bani,
already
noted
in
the
analysis
the
6.21m
flood,
are
amplified
in
floods
which
only
reach
around
6m
in
height
at
the
Mopti
gauge,
confirming
the
poor
flood
provision this "upstream part of the Delta".
2
-
Flooded
areas
according
to
the
Landsat
images
of
November
2006
and
which
are
not
flooded
by
the
model
extend
over approximately 102,845 ha.
Distribution
of
fully
or
partly
flooded
areas
on
the
Landsat
images
of
November
2006
and
not
flooded
by
the
model
according
to
the
flood
depth
of
vegetation
associations.
![Flood depth (m) F ully flooded areas (ha) Partly flooded a reas (ha) - 0.60 m 29 268 21 626 ] - 0.60 à - 0.30] 11 828 32 570 ] - 0.30 à - 0.05] 1 587 5 940](index_htm_files/13361.png)
597_2006.rar
Download